Showing posts with label loudspeakers. Show all posts

Monday, May 28, 2018

Hooked on the Science of Sound


This past month, I was interviewed by Bruel & Kjaer's, "Waves Magazine" in their Expert Profile feature. For those people not familiar with Bruel & Kjaer located in Denmark they are one of the oldest (in operation since 1942) best known manufacturers of acoustic and vibration measurement equipment.

The interviewer was interested in how my career transitioned from musician to recording engineering to acoustic/psychoacoustics. Essentially, my career has been a world-wind trip through the Circle of Confusion where I was guided by my interests, curiosity in the perception and measurement of sound, and the opportunities I was presented at the time. There was no master plan. Hopefully, we've helped remove some of the confusion in the circle by providing with a better understanding of what influences the quality of recorded and reproduced sound, and how to make it better and more consistent.

You can read the entire interview here:

Wednesday, July 3, 2013

The Science and Marketing of Sound Quality

To my surprise, this morning an audio friend tweeted a link to an article I recently wrote for our company's  internal newsletter  entitled, "The Science and Marketing of Sound Quality."  My article can be found on a new Harman Innovation website  launched today that features articles on current and future disruptive technology that will impact consumers' infotainment experiences. Check it out.

My article focuses on a longstanding pet peeve of mine (first mentioned in this blog posting): The lack of  perceptually meaningful loudspeaker and headphone specifications in our industry.  While consumer surveys repeatedly report sound quality to be a driving factor in their audio equipment purchases, consumers lack the necessary tools and information to identify the good sounding products from the duds.

This is particularly true for loudspeakers and headphones where the typical throw-away "10 Hz to 40 kHz" specification provided by the manufacturer is utterly useless. This specification only guarantees that the product makes sound, with no guarantee that the sound is good.  While the science exists today to accurately quantify and predict the perceived the sound quality of  loudspeakers (and hopefully, soon headphones), the audio industry continues to drag its heels into the 21st century,  and not routinely provide this information to consumers.

A rare exception is JBL Professional who provides comprehensive detailed measurements on studio/broadcast monitors like the new JBL M2 Master Reference shown below. Inspecting the measured frequency response curves shown  below, you can easily recognize the loudspeaker sounds exceptionally neutral and accurate based on the shape (flat, smooth, and extended)  Based on this set of measurements, we can predict how a listener would rate the sound quality of the loudspeaker in a controlled listening test, with 86% accuracy. The only pertinent information not shown in this graph is how loud the loudspeaker will play before producing audible distortion (trust me, this loudspeaker will play very loud! )

Perceptually meaningful loudspeaker specifications like these have been available for almost 30 years! Yet,  these specifications are currently not part of any professional and consumer loudspeaker standard. Such a standard would go a long way towards improving the quality and consistency of recorded and reproduced sound. Audio consumers want to hear the truth. We need to provide better information and audio specifications so they can find it.

JBL M2 Master Reference Monitor provides true reference sound quality that is clearly indicated by its technical measurements shown below. 
The spatially-averaged frequency response curves of the JBL M2  (from top to bottom) for the listening window (green), the first reflections (red), and the total radiated sound power.  At the bottom are shown directivity indices of the sound power (dotted blue) and first reflections (dotted red). These measurements tell us that the quality of the direct and reflected sounds produced by the loudspeaker will be very accurate and neutral over a relatively wide listening area.


Saturday, October 31, 2009

Audio's Circle of Confusion

Audio’s “Circle of Confusion” is a term coined by Floyd Toole [1] that describes the confusion that exists within the audio recording and reproduction chain due to the lack of a standardized, calibrated monitoring environment. Today, the circle of confusion remains the single largest obstacle in advancing the quality of audio recording and reproduction.

The circle of confusion is graphically illustrated in Figure 1. Music recordings are made with (1) microphones that are selected, processed, and mixed by (2) listening through professional loudspeakers, which are designed by (3) listening to recordings, which are (1) made with microphones that are selected, processed, and mixed by (2) listening through professional monitors...... you get the idea. Both the creation of the art (the recording) and its reproduction (the loudspeakers and room) are trapped in an interdependent circular relationship where the quality of one is dependent on the quality of the other. Since the playback chain and room through which recordings are monitored are not standardized, the quality of recordings remains highly variable.


Creating Music Recordings Through An Uncalibrated Instrument


A random sampling of ones own music library will quickly confirm the variation in sound quality that exists among different music recordings. Apart from audible differences in dynamic range, spatial imagery, and noise and distortion, the spectral balance of recordings can vary dramatically in terms of their brightness and particularly, the quality and quantity of bass. The magnitude of these differences suggests that something other than variations in artistic judgment and good taste is at the root cause of this problem.


The most likely culprits are the loudspeakers and rooms through which the recording were made. While there are many excellent professional near-field monitors in the marketplace today, there are no industry guidelines or standards to ensure that they are used. The lack of meaningful, perceptually relevant loudspeaker specifications makes the excellent loudspeakers difficult to identify and separate from the truly mediocre ones. To make matters worse, some misguided recording engineers monitor and tweak their recordings through low-fidelity loudspeakers thinking that this represents what the average consumer will hear. Since loudspeakers can be mediocre in an infinite number of ways, this practice only guarantees that quality of the recording will be compromised when heard through good loudspeakers [1]. This is very counterproductive if we want to improve the quality and consistency of audio recording and reproduction.


Another significant source of variation in the recording process stems from acoustical interactions between the loudspeaker and the listening room [1]-[3] Below 300-500 Hz, the placement of the loudspeaker-listener can cause >18 dB variations in the in-room response due to room resonances and placing the loudspeaker in proximity to a room boundary.
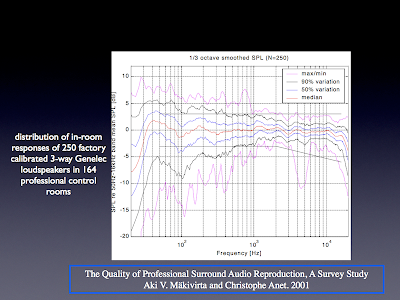

Evidence of acoustical interactions has been well documented survey of 164 professional recording studios where the same high-quality, factory calibrated monitored was installed [4]. Figure 2 shows the distribution of in-room responses measured at the primary listening location where the recordings are monitored and mixed. The 1/3-octave smoothed curves show a reasonably tight ± 2.5 dB variation above 1 kHz. However, below 1 kHz, variation in the in-room response gets progressively much worse at lower frequencies. Below 100 Hz, the in-room bass response can vary as much 25 dB among the different control rooms! You needn’t look any further than here to understand why the quality and quantity of bass is so variable among the recordings in your music library.


Evaluating Loudspeakers When the Recording is a Nuisance Variable


Loudspeaker manufacturers are also trapped in the circle of confusion since music recordings are used by listening panels, audio reviewers, and consumers to ultimately judge the sound quality of the loudspeaker. The problem is that distortions in the recording cannot be easily separated from those produced by the loudspeaker. For example, a recording that is too bright can make a dull loudspeaker sound good, and an accurate loudspeaker sound too bright [5]. A review of the scientific literature on loudspeaker listening tests indicates that recordings are a serious nuisance variable that need to be carefully selected and controlled in the experimental design and analysis of test results.


At Harman International, we try to minimize loudspeaker-program interactions in our loudspeaker listening tests by using well-recorded programs that are equally sensitive to distortions found in loudspeakers. Listeners become intimately familiar with the sonic idiosyncrasies of the different programs through extensive listener training and participation in formal tests. In each trial of a loudspeaker test, the listener can switch between different loudspeakers using the same program, which allows them to better separate the distortions in the program (which are constant), from the distortions in the loudspeaker.


Through 25+ years of well-controlled loudspeaker listening tests, scientists have identified the important loudspeaker parameters related to good sound, which can be quantified in a set of acoustical measurements [6],[7] By applying some statistics to these measurements, listeners’ loudspeaker preferences can be predicted [8]. The bass performance of the loudspeaker alone accounts for 30% the listener’s overall preference rating. Good bass is essential to our enjoyment of music, which unfortunately is a frequency range where loudspeakers and rooms are most variable (see Figure 2). Controlling the behavior of loudspeakers and rooms at low frequencies is essential to achieving a more consistent quality of audio recording and reproduction. Fortunately, there are technology solutions today that provide effective control of acoustical interactions between the loudspeaker and rooms.


Breaking the Circle of Circle of Confusion


As Toole points out in [1], the key in breaking the circle of confusion lies in the hands of the professional audio industry where the art is created. A meaningful standard that defined the quality and calibration of the loudspeaker and room would improve the quality and consistency of recordings. The same standard could then be applied to the playback of the recording in the consumer’s home or automobile. Finally, consumers would be able to hear the music as the artist intended.


References


[1] Floyd E. Toole, Sound Reproduction: The Acoustics and Psychoacoustics of Loudspeakers and Rooms, Focal press (July 2008).


[2] Floyd Toole, “Loudspeakers and Rooms: A Scientific Review,” J. Audio Eng. Soc., Vol. 54, No. 6, (2006 June). A free copy of this paper can be downloaded here


[3] Sean E. Olive and William Martens “Interaction Between Loudspeakers and Room Acoustics Influences Loudspeaker Preferences in Multichannel Audio Reproduction,” presented at the 123rd Convention of the AES, preprint 7196 (October 2007).


[4] Aki V. Mäkivirta and Christophe Anet, “The Quality of Professional Surround Audio Reproduction, A Survey Study,”19th International AES Conference: Surround Sound - Techniques, Technology, and Perception (June 2001).


[3] Todd Welti and Allan Devantier, “Low-frequency Optimization Using Multiple Subwoofers,” Audio Eng. Soc., Vol. 54, No. 5, (May 2006). A free copy of this paper can be downloaded here


[4] Sean E. Olive, John Jackson, Allan Devantier, David Hunt, and Sean Hess, “The Subjective and Objective Evaluation of Room Correction Products,” presented at the 127th AES Convention, New York, preprint 7960 (October 2009).


[5] Sean E. Olive,”The Preservation of Timbre: Microphones, Loudspeakers, Sound Sources and Acoustical Spaces,”8th International AES Conference: The Sound of Audio (May 1990)


[6] Floyd E. Toole, “Loudspeaker Measurements and Their Relationship to Listener Preferences: Part 1,” J. Audio Eng. Soc., Vol. 34,No.4, pp.227-235, (April 1986). A free copy of this paper can be downloaded here


[7] Floyd E. Toole, “Loudspeaker Measurements and Their Relationship to Listener Preferences: Part 2,” J. Audio Eng. Soc., Vol. 34, No.5, pp. 323-348, (May 1986). A free copy of this paper can be downloaded here


[8] Sean E. Olive, “A Multiple Regression Model for Predicting Loudspeaker Preference Using Objective Measurements: Part II - Development of the Model,” presented at the 117th Convention of the AES, preprint 6190 (October 2004).


Thursday, April 9, 2009

The Dishonesty of Sighted Listening Tests


An ongoing controversy within the high-end audio community is the efficacy of blind versus sighted audio product listening tests. In a blind listening test, the listener has no specific knowledge of what products are being tested, thereby removing the psychological influence that the product’s brand, design, price and reputation have on the listeners’ impression of its sound quality. While double-blind protocols are standard practice in all fields of science - including consumer testing of food and wine - the audio industry remains stuck in the dark ages in this regard. The vast majority of audio equipment manufacturers and reviewers continue to rely on sighted listening to make important decisions about the products’ sound quality.

An important question is whether sighted audio product evaluations produce honest and reliable judgments of how the product truly sounds.


A Blind Versus Sighted Loudspeaker Experiment

This question was tested in 1994, shortly after I joined Harman International as Manager of Subjective Evaluation [1]. My mission was to introduce formalized, double-blind product testing at Harman. To my surprise, this mandate met rather strong opposition from some of the more entrenched marketing, sales and engineering staff who felt that, as trained audio professionals, they were immune from the influence of sighted biases. Unfortunately, at that time there were no published scientific studies in the audio literature to either support or refute their claims, so a listening experiment was designed to directly test this hypothesis. The details of this test are described in references 1 and 2.


A total of 40 Harman employees participated in these tests, giving preference ratings to four loudspeakers that covered a wide range of size and price. The test was conducted under both sighted and blind conditions using four different music selections.


The mean loudspeaker ratings and 95% confidence intervals are plotted in Figure 1 for both sighted and blind tests. The sighted tests produced a significant increase in preference ratings for the larger, more expensive loudspeakers G and D. (note: G and D were identical loudspeakers except with different cross-overs, voiced ostensibly for differences in German and Northern European tastes, respectively. The negligible perceptual differences between loudspeakers G and D found in this test resulted in the creation of a single loudspeaker SKU for all of Europe, and the demise of an engineer who specialized in the lost art of German speaker voicing).


Brand biases and employee loyalty to Harman products were also a factor in the sighted tests, since three of the four products (G,D, and S) were Harman branded. Loudspeaker T was a large, expensive ($3.6k) competitor's speaker that had received critical acclaim in the audiophile press for its sound quality. However, not even Harman brand loyalty could overpower listeners' prejudices associated with the relatively small size, low price, and plastic materials of loudspeaker S; in the sighted test, it was less preferred to Loudspeaker T, in contrast to the blind test where it was slightly preferred over loudspeaker T.


Loudspeaker positional effects were also a factor since these tests were conducted prior to the construction of the Multichannel Listening Lab with its automated speaker shuffler. The positional effects on loudspeaker preference rating are plotted in Figure 2 for both blind and sighted tests. The positional effects on preference are clearly visible in the blind tests, yet, the effects are almost completely absent in the sighted tests where the visual biases and cognitive factors dominated listeners' judgment of the auditory stimuli. Listeners were also less responsive to loudspeaker-program effects in the sighted tests as compared to the blind test conditions. Finally, the tests found that experienced and inexperienced listeners (both male and female) tended to prefer the same loudspeakers, which has been confirmed in a more recent, larger study. The experienced listeners were simply more consistent in their responses. As it turned out, the experienced listeners were no more or no less immune to the effects of visual biases than inexperienced listeners.


In summary, the sighted and blind loudspeaker listening tests in this study produced significantly different sound quality ratings. The psychological biases in the sighted tests were sufficiently strong that listeners were largely unresponsive to real changes in sound quality caused by acoustical interactions between the loudspeaker, its position in the room, and the program material. In other words, if you want to obtain an accurate and reliable measure of how the audio product truly sounds, the listening test must be done blind. It’s time the audio industry grow up and acknowledge this fact, if it wants to retain the trust and respect of consumers. It may already be too late according to Stereophile magazine founder, Gordon Holt, who lamented in a recent interview:


“Audio as a hobby is dying, largely by its own hand. As far as the real world is concerned, high-end audio lost its credibility during the 1980s, when it flatly refused to submit to the kind of basic honesty controls (double-blind testing, for example) that had legitimized every other serious scientific endeavor since Pascal. [This refusal] is a source of endless derisive amusement among rational people and of perpetual embarrassment for me..”


References


[1] Floyd Toole and Sean Olive,”Hearing is Believing vs. Believing is Hearing: Blind vs. Sighted Listening Tests, and Other Interesting Things,” presented at the 97th AES Convention, preprint 3894 (1994). Download here.


[2] Floyd Toole, Sound Reproduction: The Acoustics and Psychoacoustics of Loudspeakers and Rooms, Focal Press, 2008.

Sunday, December 28, 2008

Part 3 - Relationship between Loudspeaker Measurements and Listener Preferences


Part 1 of this article presented experimental evidence from a study conducted by the author demonstrating that trained and untrained listeners prefer the same loudspeakers (see reference 1). Part 2 showed that the trained listeners performed 3 to 20 times better than untrained listeners based on their ability to give discriminating and reliable loudspeaker ratings. In part 3, we examine the relationship between the listeners' loudspeaker preferences and a set of anechoic measurements performed on the loudspeakers used in that study.

The mean loudspeaker preference ratings and 95% confidence intervals, averaged across all listeners, are plotted for each of the four loudspeakers (see the graph to the right). According to the definition of the preference scale, listeners liked loudspeakers P and I, were relatively neutral towards loudspeaker B, and they disliked loudspeaker M.


The next graph on the right shows a set of anechoic measurements for each of the four loudspeakers P, I, B, and M, shown in descending order based on their subjective preference rating. Each loudspeaker was measured at 70 different angles around its horizontal and vertical orbits in order to fully characterize the quality of its on and off-axis sounds, and allow removal of acoustical interference effects from resonances, which can cause harmful colorations to the reproduced sound. These resonances are visually presented as peaks and dips in the frequency response. In each graph, the frequency curves represent, from top to bottom, the quality of the direct sound, the average listening window, the first reflections, the sound power, and the directivity indices for the first reflections and the sound power. The reader is referred to references 2-4 for more background on how these measurements were derived and experimentally validated through controlled listening tests.

There are clear visual correlations between listeners' loudspeaker preferences and the set of frequency graphs. Both trained and untrained listeners clearly preferred the loudspeakers with the flattest, smoothest and most extended frequency response curves, as exhibited in the measurements of loudspeakers P and I. Loudspeaker B was rated lower due to its less extended, bumpy bass, and a large hole centered at 3 kHz in its sound power curve. The measurements of Loudspeaker M indicate it has a lack of low bass, and has a non-smooth frequency response in all of its measured curves. Both the direct and reflected sounds produced by this loudspeaker will contribute serious colorations to the timbre of reproduced sounds.

It is both satisfying and reassuring to know that both trained and untrained listeners recognize and prefer accurate loudspeakers, and that the accuracy can be characterized with a set of comprehensive anechoic measurements. The next logical step is to use these technical measurements as the basis for modeling and predicting listeners' preference ratings. This will be the topic of a future post in this blog.

References

[1] Sean E. Olive, "Differences in Performance and Preference of Trained Versus Untrained Listeners in Loudspeaker Tests: A Case Study," J. AES, Vol. 51, issue 9, pp. 806-825, September 2003. (download for free courtesy of Harman International)
[2] Floyd E. Toole, "Loudspeaker Measurements and Their Relationship to Listener Preferences: Part 1" J. AES Vol. 23, issue 4, pp. 227-235, April 1986. (download for free courtesy of Harman International).
[3] Floyd E. Toole, "Loudspeaker Measurements and Their Relationship to Listener Preferences: Part 2," J. AES, Vol. 34, Issue 5, pp. 323-248, May 1986. (download for free courtesy of Harman International)
[4] Allan Devantier, "Characterizing the Amplitude Response of Loudspeaker Systems," presented at the 113th AES Convention, October 2002.

Friday, December 26, 2008

Part 1- Do Untrained Listeners Prefer the Same Loudspeakers as Trained Listeners?


One of the more controversial topics among audio researchers is whether or not trained listeners should be used for audio product testing and research. The argument against using trained listeners is based on a belief that their tastes and preferences in sound quality are fundamentally different from those of the general untrained listener population for whom the product is intended.

There are few published studies to support the notion that trained listeners have different loudspeaker preferences than untrained listeners. To study this question, the author conducted a large study (see reference 1) that compared the loudspeaker preferences of 300+ untrained and trained listeners. Over the course of 18 months, an identical controlled, double-blind listening test was repeated with different groups of trained and untrained listeners who rated 4 different loudspeakers on an 11-point preference scale using 4 different music programs. Loudspeaker positional effects were controlled via an automated speaker shuffler that moves each loudspeaker into the exact same position.

The mean loudspeaker preference ratings for the different groups of listeners are summarized in the above graph. In terms of rank order, the loudspeaker preferences of the untrained listeners (highlighted in red) are essentially the same as those of the trained listeners (highlighted in blue). As a group, the trained listeners tended to give lower ratings, suggesting they may be more difficult to please. An important conclusion from this study is that the loudspeaker preferences of trained listeners can be safely extrapolated to the tastes of consumers having little or no formal listener training. The study did find significant differences between the trained and untrained listeners in terms of how well performed their listening task. This will be discussed in Part 2 that will appear in the next posting of this blog.

Reference 1: Sean. E Olive, "Differences in Performance and Preference of Trained Versus Untrained Listeners in Loudspeaker Tests: A Case Study," J. AES, Vol. 51, issue 9, pp. 806-825, September 2003.

This paper can be purchased from the Audio Engineering Society here, or downloaded for free courtesy of Harman International.


Tuesday, December 23, 2008

Welcome to My Blog on The Science of Sound Recording and Reproduction

This blog is concerned with all matters related to the quality of recorded and reproduced sound. Some of the topics I hope to cover in upcoming posts include recording technology, listening tests, loudspeakers, headphones, automotive audio, and acoustical interactions between loudspeakers and listening rooms.

I am an audio scientist by profession, and in matters related to the sound quality, I prefer to make conclusions based on hard scientific evidence gathered through properly controlled listening tests and meaningful objective measurements. Unfortunately, most of the audio industry doesn't operate this way. Why not? Quality subjective and objective measurements require significant investments in time, facilities, and expertise, whereas opinions on sound quality cost almost nothing.  Sometimes you get what you pay for.

I'm particularly  interested in the psychoacoustics of audio (i.e. the relationship between the human perception and measurement of sound). Here, controlled listening tests play an important role  since they permit scientists to make accurate, reliable and valid correlations between listeners' preferences and the variables being tested (e.g. different loudspeakers, room treatments, etc). From these listening tests  will hopefully emerge  a set of measurement and design rules from which the audio chain can be consistently optimized to produce a quality listening experience. 

I hope the reader will find this blog educational and entertaining.

Note:  The above photograph shows a listener auditioning different loudspeakers in Harman International's Multichannel Listening Lab.  Loudspeaker positional effects are controlled by an automated speaker mover that shuffles each loudspeaker into the same exact position within 3 seconds. During the test, an acoustically transparent but visually opaque curtain (shown in the up position here) is dropped in front of the loudspeakers so that the listener is not biased by visual factors such as loudspeaker size, brand, price,etc.